- En
- Fr
- عربي


Mitigating Climate Change Impacts on Lebanon's Tourism Sector: Strategies for Resilience and Sustainability
Mitigating Climate Change Impacts on Lebanon's Tourism Sector: Strategies for Resilience and Sustainability
Introduction
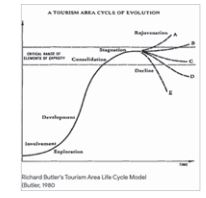
Travel destinations are bound by the life cycle principle that was first explained by Butler (Centre, 2020)1. According to this principle, a destination initially undergoes exploration with minimal tourist services available. Subsequently, various stakeholders become involved in its development, gradually introducing more services and customized activities. In the context of travel destinations, it may be beneficial to incorporate an additional phase into this cycle: "climate change adaptation."
During this phase, destinations would proactively assess the adverse impacts of climate change on their activities and the potential risks to their revenue. Climate change adaptation could encompass a series of investments that necessitate a shift toward a new specialization when the destination approaches the final decline phase, or it could involve a range of adaptive measures designed to postpone the onset of the final decline.
This paper has for objective to analyze the impact of climate change on Lebanon's tourism sector by examining key tourism indicators such as revenue and arrivals. This article will first outline the country's climate, classified as a mild Mediterranean climate according to the Köppen system, and then explore how climate change is altering these conditions.
Moreover, the article will investigate the direct and indirect effects of these environmental changes on tourism in Lebanon, linking shifts in climate to potential declines or fluctuations in tourism activity. Finally, it will put forward strategies to mitigate the negative consequences of climate change on the industry of tourism in Lebanon, ensuring its resilience and sustainability while facing ongoing challenges at the environmental scale.
I. Climate change and its indicators
A. Definition of climate change
Climate change is a phenomenon that results in several effects including global warming. This section will shed light on the difference between warming and change before analyzing climate and economic indicators and studying the assessments of forecasts for 2050 and 2100 under several scenarios.
The term change implies a modification of an element that identifies itself by certain attributes and subsequently presents itself as something else. It may be that the phase through which this element passes to leave a certain status and arrive at another is itself subject to external or internal implications. This passage from one state to another modifies the identity of an element partially or completely according to the intensity of the process and according to the intervening factors. In his dictionary of philosophy, (Baraquin, 2007)2 defines the term change as a “quantitative or qualitative transformation of the same reality”. It implies a reality that remains unchanged but which during the process of transformation brings new evidence. The author does not indicate whether this transformation is positive or negative but adds that it might have a post-transformation quantitative attribute that might reflect a negative quality.
The IPCC (Intergovernmental Panel on Climate Change) is an organization initially established in 1988 by the United Nations Environment Program (UNEP) whose mission is to evaluate and scientifically synthesize technical, social, and economic information, (Weart, 2019)3 on the evolution of climate change. It also studies the possible consequences of this change and proposes strategies and methods to limit them and adapt to current and medium- and long-term consequences. This organization demonstrates that the human factor is a determining factor, thus proving that climate change is a consequence that is not solely the responsibility of the natural factor. All of the variations in climatic characteristics generating a change in the climate over time towards warming and/or cooling would be the result of human activities.
It is stated in the definition of the climate change phenomenon by the IPCC that the consequences of climate change will last over extended periods (up to decades) and that the human factor plays a key role in the degradation contributing to the expected results short and long term. These results, which are harmful to overall well-being, are also harmful to the international economy in particular and specifically to the tourism sector. It is inevitable to analyze these results which are now measurable by the IPCC using statistical tools and data collection established by experts. These results are adopted by several international organizations, which underlines the importance and reliability of the statistics generated by these reports.
To this definition of climate change, is added in the 5th report of the IPCC the idea that it is extremely probable (with a level of confidence greater than 95%) that the influence of human activity is the primary cause of climate change and that the impact felt in the 20th and 21st centuries is largely attributed to human responsibility. According to the IPCC, climate change is accompanied by a disruption of the water cycle, and an increase in the frequency and intensity of natural disasters of climate origin (e.g., storms). Added to this is the threat of the disappearance of certain coastal areas such as coral reefs and/or certain beaches.
B. Climate change indicators
A definition of climate change has been explained by the IPCC which was created to study climate change and present the risks of it on the economy in general by offering potential solutions to organizations (IPCC, 2019)4. Organizations are established to study the evolution of climate change and present reports highlighting its consequences. Indicators are thus made available to analyze this phenomenon.
According to the National Observatory on the Risks of Global Warming (ONERC), an indicator is information associated with a phenomenon that makes it possible to indicate its evolution. (Gouv.fr, 2020).5 In other words, it is about concrete data and facts allowing us to note the existence of a phenomenon. These indicators form the identity of the phenomenon of climate change, they are its attributes and are indications that define it.
Climate indicator: high greenhouse gas emissions
Greenhouse gases have always existed and it makes sense to understand that they are part of the natural process of life on Earth. Their concentrations have increased considerably from the pre-industrial period until today. (Singh, 1996)6. If the emission of greenhouse gases continues to increase at the current rate, an average increase of two degrees in the average global temperature by 2050 and 2100 could take place. According to the US Environmental Protection Agency (EPA), the main sector that emits the most greenhouse gases is the transport sector followed by the electricity sector with 29% and 28%, respectively. Agriculture occupies the last position with less than 10%(EPA, 2017)7.
The concentration of greenhouse gases in the atmosphere has increased since the Industrial Revolution. Among the various greenhouse gases present in the atmosphere, CO2 concentrations have increased by 40%, from 280 parts per million (ppm) in 1750 (before the industrial revolution) to the current concentration of 400 ppm. The transport sector ranks first position in terms of greenhouse gas emissions – i.e., 30%. This is due to the impact of tourism which requires sea, land, and air transport of visitors. Tourists rely on air travel for vacation and work trips and thus generate high rates of greenhouse gas emissions (CO2).
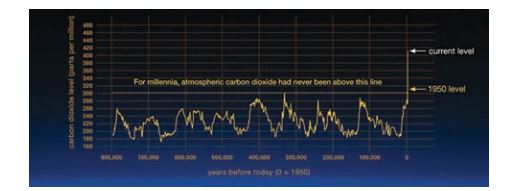
The graph above was constructed from studies conducted between 2008 and 2010 to demonstrate the general evolution of CO2 emissions in the air over the past 800,000 years(Luthi & Etheridge, 2008, 2010)8.
The emission of CO2 is a process comprising human, natural, and plant respiration without which life on earth would not develop normally. From the graph above, two main points should be identified. First, the current level of carbon dioxide emissions into the atmosphere has never been reached in the past 800,000 years. Second, the emissions in question had risen and fallen steadily with at least two major periods of difficulties every 100,000 years. These analyses show that human activity contributes to global warming. On the other hand, nature also occupies an important status as a key contributing factor to global warming.
Sea level rise
Measured using a tide gauge, the sea level acts as a reference for evaluating and geographically positioning places. Being a liquid matter and due to the difficulties generated by the tides, we speak of a mean sea level by measuring the average height of the surface of the water on Earth.
It is indeed the measurement of the altitude of the surface of the water in an ocean by considering a fixed point on the ground. This measurement is necessary in several fields, in particular cartography and aviation which calibrates the altitude according to this level. The measurement referred to by the building construction sector may vary due to several aspects including wind, its direction, climate change, and its effects. Increasing emissions of greenhouse gases that concentrate in the atmosphere are accelerating global warming and intensifying the effects of climate change. The ocean absorbs an exceptionally large amount of heat emitted by these gases – this is a greater amount than that absorbed by the atmosphere (Cheng, 2019)9. The oceans have contributed to the reduction of greenhouse gas emissions in the atmosphere by capturing nearly 90% of the heat caused by these gases, but there are also negative effects directly and indirectly linked to the seas and oceans. (Cheng, 2019). To obtain fairly precise results, satellites are used to digitally study changes in sea level.
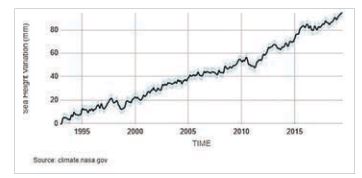
These satellites have, for example, precisely shown an increase of more than three millimeters per year between 1993 and today. Among the various causes of sea level rise are rising temperatures and intense flooding. (Choudhury, 1997)10. Intense rainfall generates floods which would naturally flow into the sea and contribute to the rise in sea and ocean levels11. The most important causes of rising sea levels are rising ocean temperatures in particular and glacial melting. Before developing these two points, it is appropriate to study the evolution of sea levels from 1993 until today. According to NASA (National Aeronautics and Space Administration), the current average sea level rise is 3.3 millimeters per year. This development experienced a slight decline in the late 1990s and early 2010, but this did not mean that the sea level was falling. This increased but at an exceptionally slower rate during these periods.
The increase in temperatures leads on the one hand to a phenomenon of extreme precipitation which itself generates another phenomenon of flooding. Both lead to sea level rise. But the melting of glaciers plays an especially key role in the rapid rise in sea level. Between 2000 and 2015 the Greenland and Antarctic ice sheets lost 100 to 200 gigatons of ice per year per ice sheet. For the global sea level to rise by a single millimeter, 360 gigatons of ice must melt (Scambos, 2011)12. During the Pliocene era, around three million years ago, CO2 concentrations in the atmosphere were similar to those of today. Average temperatures were 2-3 degrees warmer than felt today (Meyer, 2019)13.
Added to this is that the sea level, at the time in question, would have risen to twenty-five meters above its current level. But these studies showed that the melting of Greenland would have contributed only five meters of sea level rise while the remaining 20 meters came from the melting of Antarctica. Another element is thus added to the melting of the Greenland ice cap which would lead to a rapid rise in sea level. Led by Australian researchers, published paper shows sea levels could rise twenty-five meters by 2030 (GUZMAN, 2019)14. The rise in mean sea level is considered to be a rapid and continuous phenomenon. A study by the Department of Geography and Environment at the University of Waterloo in Canada showed that 30% of seaside resorts would partially or completely disappear for just one meter more rise in mean sea level in the Caribbean (Scott, 2012)15. The damage that tourist countries will face will be high in terms of coordination, infrastructure, and human capital.
II. Tourism indicators and Destination competitiveness
To study climate change and its trends from an economic perspective, it is important to use indicators in this area. It is thus possible to study the changes between the dimensions of these economic indicators on the one hand and those of climate change on the other to explain the link depending on the potential results. An economic indicator is quantitative information that illustrates a certain dimension of economic activity in a specific sector. These data are generally published regularly by organizations specialized in collecting statistical research. Being a reliable source of statistics providing economic indicators, the World Bank has been collecting quantitative information on development economics since 1944. It will be necessary to study first the economic indicator of gross domestic product and second, analyze the indicator of job creation. These two indicators will provide a fairly clear picture of the current economic situation, taking 2013-2018 as a reference period.
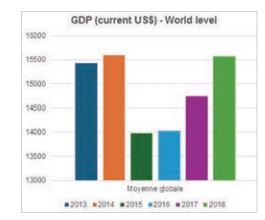
A. Gross domestic product
The gross domestic product (GDP) is one of the major benchmarks of a country's national status. It measures the economic output of a country and gives indications of the standard of living and purchasing power. The Bretton Woods conference in 1944 is the factor that made GDP the main tool for measuring a country’s economy. However, the history of GDP dates back to the 17th century when economist William Petty measured national income to present criticism of the state for raising taxes. According to the World Bank, GDP is listed under the category of development indicators in the world, and its latest update date to October 28, 2019.
B. Job Creation
According to the latest figures from the World Bank updated on October 28, 2019, the general picture shows a trend towards an increase in terms of job creation in general and the tertiary sector of services in particular. It was possible to construct the illustration below from data from the World Bank.
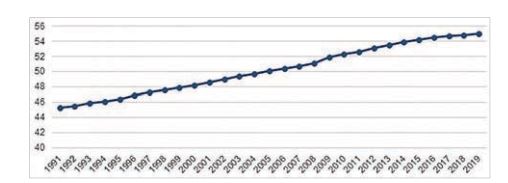
Indeed, some countries have experienced declines in terms of job creation in the service sector. For example, according to World Bank data, in 1991 20.7% of jobs were devoted to services (including tourism). This share increased in 2019 to 22%. On the other hand, Qatar, an extraordinarily rich country with 168 billion dollars, sees an average decrease of 19%, because in 2019 the share of jobs in services was 44% compared to 63% in 1991. According to this indication, it turns out that firstly, despite the average trend reflecting an increase in the number of jobs in services, negative results are appearing in many countries. Second, it turns out that some poor countries (according to the gross domestic product indicator) show an increase in terms of shares of jobs created for services, while other rich countries show the opposite.
C. Climate change and shifts in tourism demand
The climate is crucial for international tourism and tourist demand has been argued in literature to consider sociological and psychological considerations (Crouch, 1995)16. While climate is expected to show changes at an accelerating pace due to human activities and in particular due to fossil fuel combustion (Houghton, 1996)17 it is noted that the tourism industry reflects rapid change due to several reasons that include political stability; price changes; fashion but also social trends – this implies therefore that climate change would have major implications for the tourism industry.
The number of studies devoted to the tourist demand had a general focus on both international and regional scales, in addition to research conducted on domestic tourism, however, we witness a limited number of studies that consider climate and climatic change as factors or indicators within studies about tourist demand. Within tourism, there are numerous interlinked processes such as economic demand and social demand. Some factors including psychological (Maddison, 1998)18 such as time availability and the need to change the daily routine in an organized versus adventurous one form the demand of tourists, and this, in addition to other factors such as the obvious temperature being optimal for the tourist. It has been explained in a study conducted by Maddison in 1998 that the optimal temperature is about 21 degrees Celsius with a standard deviation of 3 degrees Celsius. Moreover, tourists’ demand shows a preference for dry places over wet ones with coastal areas being an attraction.
D. Destination competitiveness within tourism of business
In general, destination competitiveness refers to the capacity and ability of a destination to compete effectively and profitably in the marketplace of tourism destinations. It is also defined as the ability of a destination to increase visitor arrivals and tourist receipts by providing them with a series of services that would be deemed satisfactory and profitable. It is optimal that these services would be offered in a mutually profitable but also sustainable manner which can lead to the maintenance of the well-being of the destination and the residents as well as the natural environmental aspects. Business travelers represent a large and growing segment of the international tourism market and it is considered as one the most desirable form of tourism development at the international scale. According to the World Tourism Organization, business tourism can be positioned as a key part of the economic development strategy and is a resilient sector to vulnerabilities affecting the tourism sector (WTO, 2007)19. From a theoretical point of view, it has been explained that national competitiveness is viewed as a “Country’s ability to create, produce, distribute and service products in international trade while earning rising returns on its resources” (Scott B. R., 1985)20. Moreover, in business tourism, the competition is more intensive as countries continuously put forward various meeting venues and facilities on the market. According to the WTO, business tourism is considered as “travel to attend an activity or an event associated with business interest”.
III. The mild Mediterranean climate of Lebanon
The classification of climates by Vladimir Peter Köppen (Rumney, 2019)21 seems to present a reliable source on which this study can be based. It should first be noted that a climatic classification is only precise through a tool that makes it possible to differentiate the climatic and geographical aspects of countries according to quantitative data such as precipitation, temperatures, and other environmental data. Published in 1900, this classification is illustrated on the world map22 and has been adopted by several research and publications in climatology, geography, and several fields concerned with climate change (Beck, 2018)23. Updates are carried out frequently and therefore make this map an academic reference. Scientific articles thus take this map as an essential element for constructing studies making it possible to deduce quantitative and qualitative information. Daniel Foley, for example, in August 2019 studied water productivity over the last three decades in the most irrigated places. (Daniel J. Foley, 2019)24.
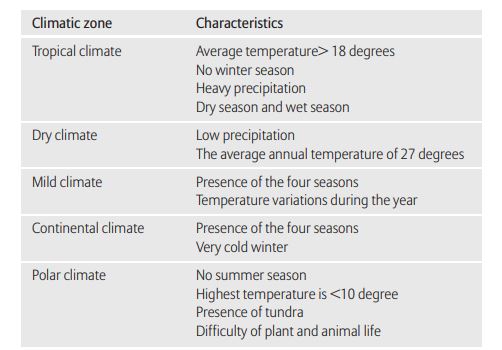
Köppen thus presents the five types of climatic zones as being: 1) the tropical climate, 2) the dry climate, 3) the temperate climate, 4) the continental climate, and 5) the polar climate (Rumney 2019)25. According to Köppen, the tropical climate is characterized by heavy annual rainfall and an average monthly temperature of 18 degrees but without a winter season. The dry climate is described as arid, which implies light rain all year round. The temperate climate has an average temperature between -3 and 18 degrees with the four seasons of the year: autumn, winter, spring, and summer. The continental climate presents wind and precipitation inland and far from the coast with a colder winter than on the coast. The polar climate, where the summer season is absent, is characterized by the hottest month with an average temperature below 10 degrees as well as very freezing winters. This section first presents the definitions of these climatic zones and lists the countries fully and partially concerned by these climatic zones. This study aims to present an observation of tourist arrivals and tourist receipts in the second section of this chapter. It is first necessary to group in a table below the five climatic zones defined by Köppen and to show their characteristics:
Key Features of Lebanon's Climate:
Summers in Lebanon are typically hot and dry, especially in the coastal and lowland areas. Average temperatures during the summer months (June to September) range from 25°C to 30°C (77°F to 86°F) but can exceed 35°C (95°F) in some regions. Rainfall is minimal during this period.
1. Mild, Wet Winters:
Winters (December to February) are mild and wet, with temperatures along the coast averaging between 10°C and 15°C (50°F to 59°F). The mountains and inland regions experience colder conditions, with temperatures often dropping below freezing and snowfall common in the higher altitudes.
2. Seasonal Rainfall:
Most of the precipitation occurs in the winter months, with rainfall tapering off by April. The coastal areas receive between 600 mm to 1,000 mm of rainfall annually, while the mountainous regions can receive more than 1,500 mm, particularly on the western slopes.
3. Regional Variations:
While the coastal regions have a typical Mediterranean climate, the interior and mountainous areas of Lebanon experience more pronounced seasonal variations. The Bekaa Valley, for instance, has a semi-arid climate with colder winters and hotter summers compared to the coastal areas.
Challenges
Lebanon's climate is increasingly affected by global climate change, leading to more extreme weather patterns, such as longer and hotter summers, reduced rainfall, and more severe droughts. These changes pose challenges to water resources, agriculture, and overall environmental sustainability.
IV. Climate change effects on Lebanon and link with tourism
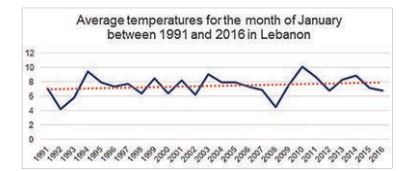
With five ski areas, Lebanon is the only country in the Middle East to offer skiing activities in natural ski resorts, the altitudes of which vary between 1,700 and 2,850 meters with three ski areas rising at an altitude between 1,000 and 2,000 meters – an absolute advantage for the Middle Eastern countries. Through the vulnerabilities and threats it exercises, climate change seems to destabilize the absolute advantage described above. The average temperature for January 2016 is similar to that of 1991, except that during this period, the months of January saw variable temperatures, the highest being 10.1 degrees in 2010, and the lowest in 1992 at 4.2 degrees. The trend (in red dots) translates according to the graph into a move towards a continuous increase.
In Lebanon, various scenarios for climate change have been formulated by utilizing a downscaled General Circulation Model known as PRECIS. These scenarios aim to project alterations in temperature and precipitation by the close of the 21st century. The findings indicate that by 2040, temperatures are anticipated to rise by approximately 1°C along the coast and 2°C inland, with further increases projected by 2090 to range between 3.5°C and 5°C, respectively. Another notable impact is on rainfall patterns, which are expected to decline by 10-20% in 2040 and potentially plummet by 45% in 2090. This shift towards a drier and consistently warmer climate will extend the duration of hot and arid conditions. Summer days are expected to experience temperatures exceeding 35°C, and tropical nights will see temperatures surpassing 25°C. Additionally, drought periods across Lebanon are forecasted to extend by 9-18 days by 2090.
Furthermore, climate change is poised to trigger a reduction of snow cover by 40% to 70%, accompanied by temperature increases of 2°C to 4°C. This will result in a shift in the elevation of snow residence time from 1,500m to 1,900m and a decrease in snow residence time from 110 days to 45 days. This will influence the rivers and groundwater recharge and will impact the water availability during the summer season and drought periods. Such changes are expected to have diverse effects on Lebanon's environment, economy, and social structure. The increase in forest fires, pest outbreaks, and sea level rise will threaten the fragile biodiversity, ecosystems, and natural habitats.
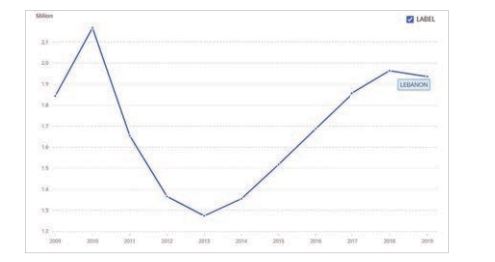
The tourism industry in Lebanon is experiencing factors that hamper its development in parallel with a fragile economic situation. Despite the satisfactory amount of natural snow for the 2019/2020 season Lebanese ski resorts are almost empty. This is mainly one of the consequences of the economic crisis facing Lebanon. The figure below shows the resiliency of Lebanese tourism: a trend towards an increase is identified despite an alarming drop in the indicator of tourist arrival in 2013.
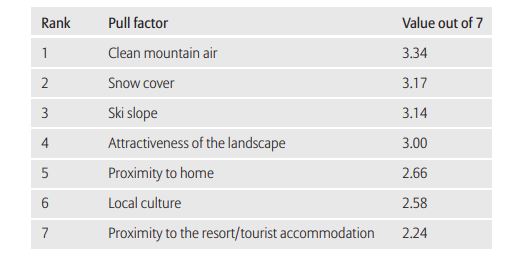
The vulnerability of Lebanese ski resorts to this economic crisis is greater than the impact of climate change. In a study that aims to study the profile of ski resorts in Lebanon, it is indicated that nearly 92% of visitors to these resorts are Lebanese – information that could be strategic for Lebanese tourism development to rely on domestic tourism. Results of a questionnaire distributed to visitors to five ski resorts in Lebanon during the ski season from December 2017 to February 2018 indicated that skiers were asked to give a score between 1 and 7 to identify and analyze the factors of incentive and attraction.
The table below shows the average values assigned to each specific factor to generate a list in order of attractiveness. The most attractive factor according to skiers in Lebanon in 2018 is the clean mountain air followed by the snow cover – elements that are directly impacted by climate change.
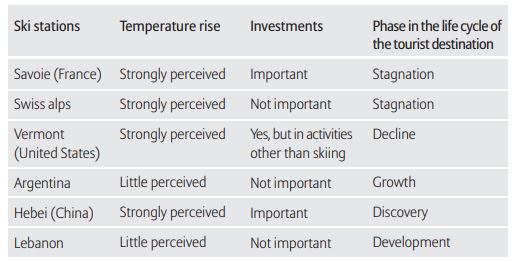
Based on a similar classification, the ski industry can be an important factor in tourism development in Lebanon because, under circumstances of economic crisis, domestic tourism from January to April can generate tourism revenue. Economic actors in Lebanon can rely on domestic tourism and on tourists from the region to generate tourism revenue. The Lebanese currency, of low value, will be able to attract international tourists who will be able to increase their demands. If skiing in Lebanon develops through economic and tourism policies, it may attract tourists from countries in the region, due to the presence of natural ski resorts nonexistent in neighboring countries of the region. The table below groups together all the information discussed in this summary. Investments in ski resorts in Savoie France are considerable and the degree of perception of the effects of climate change is high.
V. Strategies
The introduction of this paper detailed the phases of Butler’s life cycle theory. The table shown in Figure 10 indicates that, in comparison with other destinations, Lebanon's rise in mean temperature is not strongly perceived. At the same time, investment levels are not significant, suggesting that Lebanon is in the development phase of the destination life cycle.
At this stage, it is crucial to develop strategies to address key issues and find solutions for both the lack of investment and the general perceptions surrounding climate change, particularly rising temperatures. For Lebanon, it would be beneficial to implement a strategy focused on developing and promoting sustainable tourism. Existing hotels and resorts could pursue green certification to demonstrate their commitment to sustainability, attracting eco-conscious travelers and investors interested in sustainable destinations. This should be complemented by the creation and marketing of eco-tourism packages.
Additionally, it is important to enhance the perception of climate change challenges by promoting educational programs. Collaborating with educational institutions (universities and schools) and non-governmental organizations (NGOs) can help create programs that highlight the impact of rising temperatures on Lebanon and its tourism sector.
Conclusion
The analysis reveals that climate change poses significant challenges to Lebanon's tourism sector, particularly impacting its main niche: the ski industry and overall tourism revenue. The anticipated rise in temperatures and reduced snowfall will likely undermine Lebanon's competitive edge in winter sports, which has been a key attraction for both local and regional visitors.
On the other hand, the increase in extreme weather events and longer drought periods could further exacerbate the difficulties faced by the tourism sector, compounding the effects of the ongoing economic crisis. This interplay between environmental and economic pressures highlights the urgent need for adaptive strategies to mitigate these impacts. To ensure the resilience and sustainability of Lebanon's tourism industry, it is essential to implement proactive measures.
These might include diversifying tourism offerings to reduce reliance on climate sensitive activities, enhancing infrastructure to withstand extreme weather, and promoting domestic tourism to offset international visitor fluctuations. By integrating climate adaptation into strategic planning, Lebanon can better navigate the dual challenges of climate change and economic instability, preserving its rich cultural and natural assets while securing its tourism industry's future.
References
1. Al, A. E. (2015). Anthropogenic emergence in simulated climate extreme.
2. Baraquin, N. (2007). Dictionnaire Philosophique. Retrieved from Dictionnaire Philosophique: https://dicophilo.fr/definition/changement/
3. Boyle, A. (2017, October 12). NASA’s carbon-monitoring OCO-2 satellite confirms that El Nino weather boosts CO2. GeekWire, p. 2.
4. Canada, S. (2020). Retrieved from https://www150.statcan.gc.ca/n1/fr/type/donnees
5. Centre, B. F. (2020, 01 24). The Butler Model of Tourist Resort Development. Retrieved from Geography Field Work: https://geographyfieldwork.com/ButlerModel.htm
6. Change, U. N. (2011). https://unfccc.int/files/press/backgrounders/application/pdf/ press_factsh_science.pdf.
7. Cheng, L. J. (2019). 2018 continues to record global ocean warming. Adv. Atmos. Sci., 36(3), 249–252,.
8. Choudhury, A. M. (1997). Consequences of global warming and sea level rise in Bangladesh. Marine Geodesy,, 20(1), 13–31.
9. Climate. (n.d.). Climate. Retrieved from Climate-Data: https://fr.climate-data.org/ afrique/madagascar-177/
10. Crouch. (1995). A Meta-Analysis of Tourism Demand. Ann. Tourism, 22, 103–118.
11. Dedieu, J. P.-F. (2014). Shifting mountain snow patterns in a changing climate from remote sensing retrieval. Science of The Total Environment, 493, 1267–1279.
12. EPA, U. (2017). https://www.epa.gov/ghgemissions/sources-greenhouse-gas-emissions. Retrieved from https://www.epa.gov/ghgemissions/sources-greenhouse-gas-emissions: https://www.epa.gov/ghgemissions/sources-greenhouse-gas-emissions
13. Fang Wanga, Q. G. (2014). Certainty and uncertainty in understanding global warming. Chinese Journal of Population Resources and Environment, 2014, Vol 12, N. 1 - 6-12.
14. GIEC. (2014). IPCC Fifth Assessment Report. Geneva: GIEC.
15. GIEC. (2019). Monaco: GIEC.
16. Godin, C. (2004). Dictionnaire de philosophie. Retrieved from Dictionnaire de philosophie: https://dicophilo.fr/definition/changement/
17. Gouv.fr. (2020, Fevrier 12). Observatoire national sur les effets du réchauffement climatique – ONERC. Retrieved from Gov.fr: https://www.ecologique-solidaire.gouv.fr/observatoire-national-sur-effets-du-rechauffement-climatique-onerc#e2
18. GUZMAN, C.-E. (2019, 10 9). Innovation et temps qui changent. Retrieved from Le niveau des oceans pourrait s'elever de 25 metres des 2030: https://up-magazine.info/ index.php/planete/climat/28078-le-niveau-des-oceans-pourrait-selever-de-25-metres-des-2030/
19. Houghton, J. T. (1996). The Science of Climate Change – Contribution of Working Group. Cambridge University Press, Cambridge.
20. J. Hansen, 1. R. (2010). GLOBAL SURFACE TEMPERATURE CHANGE.
21. James Hansen, M. S. (2006). Global Temperature Change. Proceedings of the National Academy of Sciences of the United States of America, Vol 103 N.39 p. 14288-14293.
22. Kadaba, D. (2018). Interactive map precipitation 2050. Center for biological diversity.
23. Luetschg, M. &. (2005). Permafrost evolution in the Swiss Alps in a changing climate and the role of the snow cover. Norsk Geografisk Tidsskrift . Norwegian Journal of Geography, 59(2), 78–83.
24. Luthi, D. e., & Etheridge, D. e. (2008, 2010). Vostok ice core data.
25. Maddison, D. J. (1998). The Impact of Climate Change on Flows of British Tourists. University of Strathclyde, Strathclyde, pp. 129–157.
26. Meyer, N. (2019, 10 13). Futura Planete. Retrieved from La fonte des glaces en Antarctique pourrait faire monter le niveau des mers de 20 mètres: https://www.futura-sciences.com/planete/actualites/climatologie-fonte-glaces-antarctique-pourrait-faire-monter-niveau-mers-20-metres-47978/
27. Olufemi Adedeji, O. R. (2014). Global Climate Change. Journal of Geoscience and Environment Protection, 2014, 2, 114-122, 2, 114-122.
28. Robock, A. &. (2018). DID SMOKE FROM CITY FIRES IN WORLD WAR II CAUSE GLOBAL COOLING? Journal of Geophysical Research: Atmospheres.
29. Scambos, T. (2011). Earth’s ice: Sea level, climate, and our future commitment. Bulletin of the Atomic Scientists, 28-40.
30. Scott, B. R. (1985). US Competitiveness in the World Economy. Harvard Business School Press.
31. Scott, D. S. (2012). The vulnerability of Caribbean coastal tourism to scenarios of climate change-related sea level rise. Journal of Sustainable Tourism, 20(6), 883–898.
32. Singh. (1996). Influence d'un changement climatique dû à une hausse de gaz à effet de serre sur l'agriculture au Quebec. Atmosphere-Ocean, 379-399.
33. Steiger, R. &. (2019). Ski tourism in a warmer world: Increased adaptation and regional economic impacts in Austria. Tourism Management, 77.
34. Sui, C.-H. (2007). On the definition of precipitation efficiency. Jornals Ametsoc, 1-2.
35. Vincendon, B. (2019, 02 15). MSN. Retrieved from MSN: https://www.msn.com/fr-fr/actualite/france/infographies-y-avait-il-vraiment-plus-de-neige-avant-/ar-BBTCmCB
36. Weart, S. (2019, February). Retrieved from https://history.aip.org/history/ climate/internat.htm#S9
37. WTO. (2007) . A Practical Guide to Tourism Destination Management.. Madrid: World Tourism Organization.
التخفيف من آثار التغيّر المناخي على قطاع السياحة في لبنان: استراتيجيات للصمود والاستدامة
الدكتور محمد كيّال
يهدف هذا البحث إلى تقييم طبيعة تأثير التغيّر المناخي ومداه على قطاع السياحة في لبنان وذلك من خلال دراسة المؤشرات المناخية، والاقتصادية والسياحية الرئيسة بما في ذلك انبعاثات غازات الاحتباس الحراري، ارتفاع مستوى سطح البحر، تقلّبات درجات الحرارة، هطول الأمطار، إلى جانب مؤشرات الأداء السياحي من إيرادات وصول الوافدين وعددهم أيضًا وتنافسية الوجهة.
اعتمدت الدراسة على مراجعة تحليلية للتقارير الصادرة عن الهيئة الحكومية الدولية المعنية بتغيّر المناخ (IPCC) ومؤسسات منظمة السياحة العالمية، إضافة إلى بيانات البنك الدولي ومنظمة الأمم المتحدة للسياحة، إذ تمّ تحليل سيناريوهات المناخ المستقبلية باستخدام نموذج (PRECIS) منخفض التدرج لقياس الارتفاع المتوقع في درجات الحرارة وتراجع هطول الأمطار حتى عامَي 2050 و2100. كما تم رصد أداء القطاع السياحي في لبنان عبر الفترة 2013–2019 ومقارنته وتبيان مدى تأثيره في تطور الناتج المحلي الإجمالي، وخلق فرص العمل في القطاع الخدماتي والسياحي أيضًا.
وفي أثناء عملية البحث والدراسة، لوحظ أن هنالك عدة مؤشرات وعلى مختلف الأصعدة والمستويات توضح الحالة الراهنة للمناخ، ومدى تأثيره في قطاع السياحة على المديَين القريب والبعيد. فعلى صعيد المناخ العام دلّت البيانات على وجود ارتفاع في تركيز غاز ثاني أكسيد الكربون من 280 جزءًا من المليون قبل الثورة الصناعية إلى نحو 415 جزءًا من المليون مقارنة مع الوضع الراهن، إلى جانب ارتفاع متوسط درجات الحرارة السنوية في لبنان بمعدلٍ يتراوح بين 0.8 - 1.2 درجة مئوية منذ تسعينيات القرن الماضي، حتى على مستوى الغطاء المائي فدلت البيانات على أن منسوب مياه البحر في حالة ارتفاع دائم وبمعدلٍ سنوي بلغ 3.3 ملم سنويًا.
أما على الصعيد السياحي للمنطقة، فكشفت نتائج التحليل والبيانات عن وجود تراجع طفيف في عدد الوافدين السياح إلى المنتجعات الثلجية اللبنانية خلال مواسم الشتاء، ومن الجانب الآخر هنالك زيادة ملحوظة في الإقبال على السياحة الساحلية خلال فصل الصيف، نتيجة ارتفاع درجات الحرارة وجفاف فصول الربيع. أما على الصعيد الاقتصادي، فقد شكّل الناتج المحلي الإجمالي المرتبط بالسياحة ما نسبته 7% من إجمالي الناتج المحلي بالمقارنة مع العام 2019، وبلغت نسبة الوظائف المرتبطة بالقطاع السياحي 12% من إجمالي فرص العمل في قطاع الخدمات.
أشار البحث إلى العديد من المواضيع التي قد تعتبر أسبابًا مهمة ومؤثرة في التغير المناخي وتداعيات ذلك على قطاع السياحة في لبنان. على سبيل المثال، أوضحت نتائج البحث والتحليل أن الغطاء الثلجي قد بلغ نسبة 60% مقارنة مع تسعينيات القرن الماضي، الأمر الذي أدى إلى تراجع فعاليات منتجعات التزلج. كما أدّى التغير المناخي إلى ارتفاع معدل الجفاف في المناخ والذي يؤدي بدوره إلى ازدياد مخاطر حدوث الحرائق، وهنا يتبين تأثير التغير المناخي في القطاع الزراعي ومصادر المياه الطبيعية التي تعد أحد أهم الأسباب الرئيسة لجذب السياح ورفع معدل السياحة بشكلٍ عام.
ولا بد من أن نشمل في البحث مدى تأثير التغيّر المناخي في البنية التحتية للساحل اللبناني الذي يعد الشريان الحيوي الرئيس في حركة السياحة، إذ أشارت الدراسة إلى مدى التأثير الحالي والمستقبلي لارتفاع منسوب سطح البحر السنوي في البنية التحتية للمنطقة الساحلية.
كما أوضح البحث بناءً على التحليل والدراسة، بعضًا من الإجراءات التي قد تساعد في تخفيف الآثار السلبية لتغيّر المناخ على القطاع السياحي. على سبيل المثال لا الحصر، إن دعم قطاع السياحة على الصعيدَين البيئي والثقافي قد يساعد في الحدّ من الآثار السلبية على المنتجعات وتوفير المنتجات والاحتياجات الأساسية اللازمة لها، وعملية دعم البنى التحتية الخضراء أيضًا عن طريق تطوير مبانٍ مستدامة وتشييدها تحافظ على مصادر الطاقة الطبيعية وتطورها وتساعد بشكلٍ كبير وملحوظ على زيادة حركة السياحة في المنطقة وتحسينها. وإلى جانب ذلك، أشار البحث إلى ضرورة إعداد برامج تدريبية للكوادر الجديدة وتطوير الكوادر الموجودة المتخصصة في إدارة المخاطر، وذلك عبر الاستعانة بالشراكات مع القطاع الحكومي والمجتمع الدولي بهدف درء مخاطر التغيّر المناخي في المنطقة. كما يبيّن البحث الحلول المقترحة التي قد تساعد إلى حدّ كبير في تخفيف الأضرار الناجمة عن التغيّر المناخي، والإجراءات التي تسهم في تطوير قطاع السياحة على الصعيدَين المحلي والدولي.